Projects
Evolution of the landscape
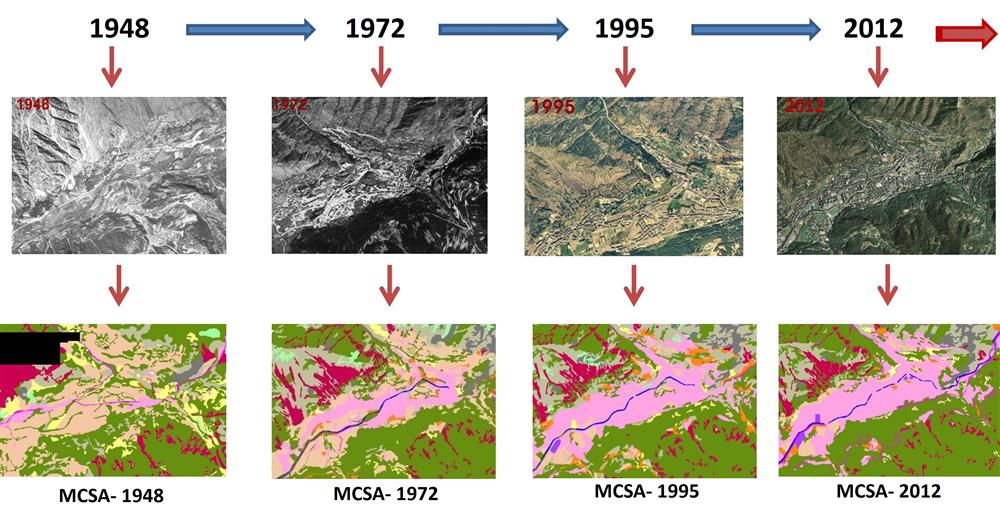
Study of landscape evolution through comparing terrain covering maps carried out from aerial photographs from 1948, 1972, 1995 and 2012.
Start date: 01/01/2001
Team:
 Meritxell Martin
 Roger Caritg
Meritxell Martin
Roger Caritg
Work strands:
Mapping
Remote sensing
Remote sensing
Financing program:
Internal
The project on the evolution of the landscape of Andorra aims to generate land cover mapping from orthophotographs of different years in order to analyse its evolution. The land cover maps are a very detailed cartography, at a scale of 1: 5,000, representing the main land covers of the country (crops, forests, urban areas, pastures ... among others).
In 2001, the former Centre de Biodiversitat de l’Institut d’Estudis Andorrans presented the first land cover map of Andorra, made from orthoimages of 1995. During the following years to carry out a work of geographical rectification of aerial photographs from 1948 and 1972 in order to provide them with geographical coordinates and to be able to generate georeferenced ground cover maps for the respective years.
The series of maps has been completed, for the time being, with the latest map, which corresponds to the year 2012.
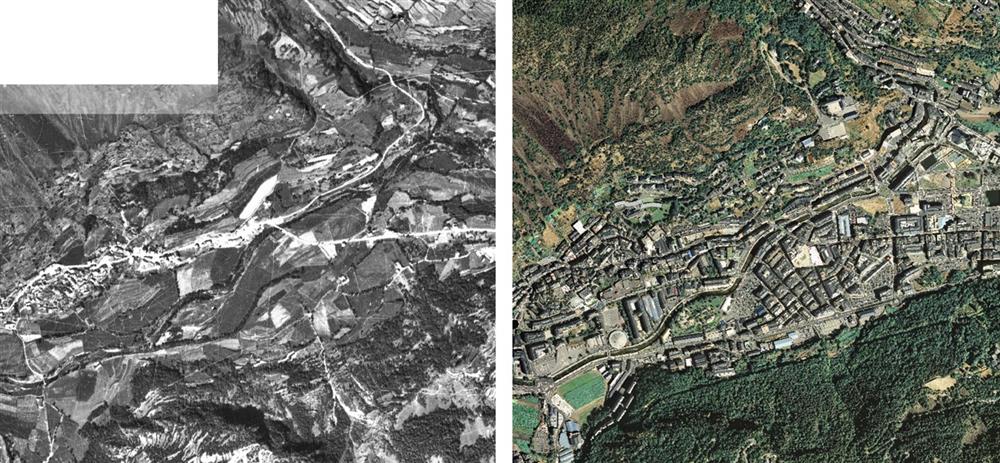
Undoubtedly, the evolution of the landscape during the 20th century and the beginning of the 21st is closely linked to anthropogenic activity and the historical moment of the country.
It should be understood that Andorra in the middle of the 20th century had a population of about 5,500 people, and the lifestyle at that time was based on farming and livestock farming, tending family gardens and forestry.
This situation changed as the decades went by. Positive migratory flows, especially due to the entry of refugees from the war and post-war periods from neighbouring countries —Spanish Civil War and World War II— and later in the 1960s, 1970s and 1980s, the improvement of the communication routes, the incursion of tourism and the establishment of commerce, led to a constant transformation of the territory, above all of the valley floor.
Gradual changes in land cover involve a series of changes in the ecological processes of the natural environment that must be analysed periodically in order to determine the state of health of the country’s biodiversity and ecosystems.
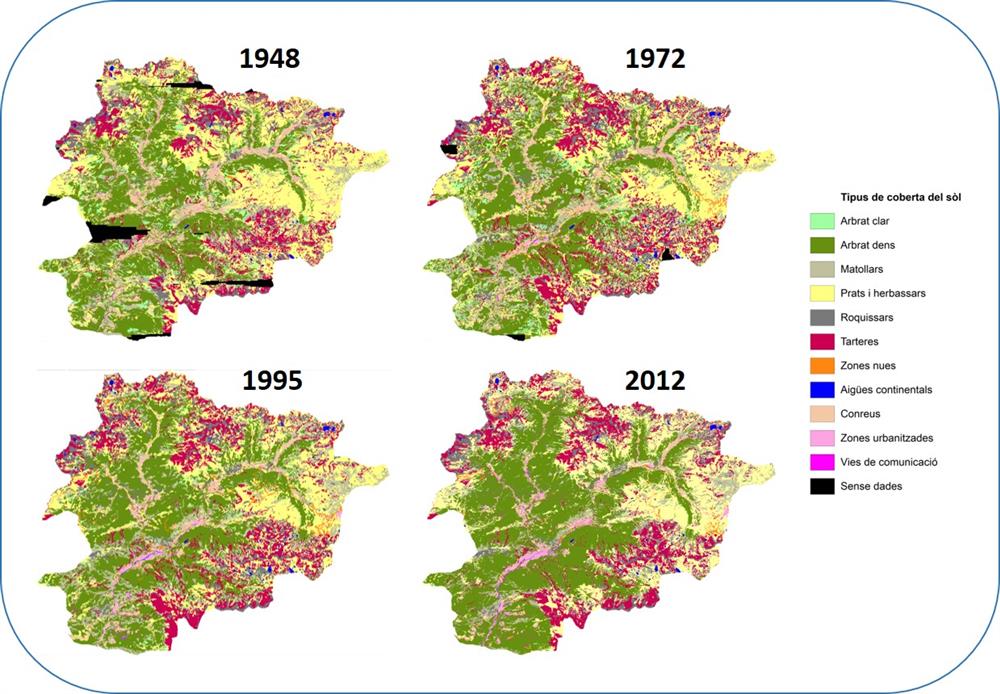
The following table shows the evolution of the areas of the different categories that make up the land cover maps of the years 1948, 1972, 1995 and 2012.
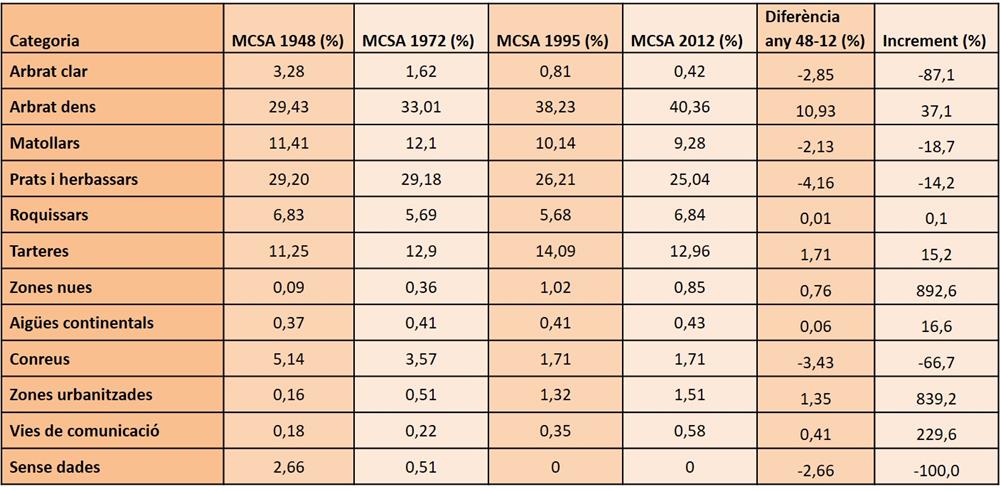
In terms of total surface area, it can be seen that the most substantial change has been the growth of the wooded area, which has increased by more than 10% of the Andorran territory. This growth has largely taken place in areas that were previously scrubland, meadows or cleared forest.
Another category that has changed substantially is that of crops. Undoubtedly, the change in the sectors of activity of the Andorran population have led over the years to a progressive abandonment of the crop area. In this case, it goes from 5% of the Andorran territory to 1.7% on the most recent map (2012). However, it should be pointed out that in the last two or three decades this surface has been maintained; therefore, in the last two maps the area allocated to this activity has remained unchanged.
The categories of urban and roadways areas have increased the most, growing from 1948 to 2012 by 839% and 230% respectively. The urban areas have increased more than 9 times and communication routes by more than 3 times.
Normally, in order to carry out this type of study on the evolution of land cover, the matrix calculation of changes is used. It is a two-dimensional table that serves to compare two maps (in the case of Andorra the two most distant maps are used, those of 1948 and 2012) in order to know the changes that have occurred between all the categories of the two maps.
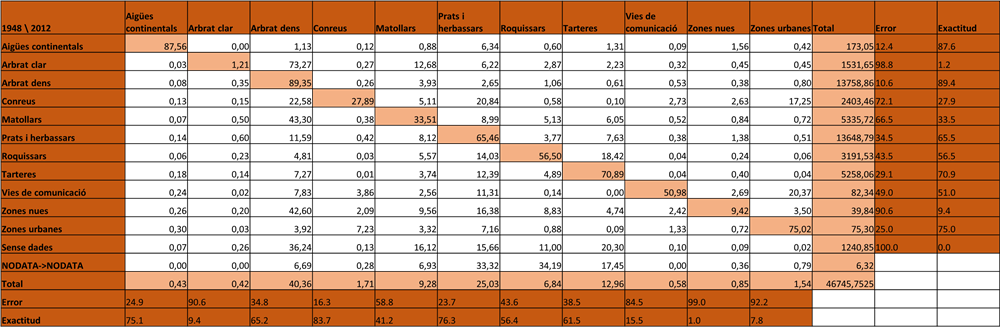
If we analyse some of the categories from the matrix of changes, we can quantify how, for example the forest has increased by 37.1% (Table 1) and has gained land in the areas of scrubland (2,310.33 ha), meadows and grasslands (1,581.73 ha) or cleared woodland (1,122.26 ha) among others.
In the case of urban areas, during the second half of the 20th century, political, economic and social changes, with a positive migratory growth, made this category the one that has grown proportionally more. This fact can be specified from the matrix of changes, which determines that this category has grown by occupying areas of crops (414.7 ha), areas of forest (110.42 ha) or areas of meadows and grasslands (70.04 ha) among other categories.
The roadways category is another that has grown the most (229.6%) and has occupied areas of forest (73.35 ha), crops (65.65 ha) and meadows and grasslands (51.19 ha) mostly.
It can be concluded that during the period from 1948 to 2012 the Andorran territory changed by 36.9%. The forest cover is the one that has grown the most in terms of extension. However, the dynamics of change between the land covers of anthropogenic origin (urban areas, roads, crops and desolate areas) located basically on the valley floor, are those that have seen a more noticeable change.
All land cover maps of Andorra are available in GIS format from the SIGMA website.
The continuity of the project is based on the elaboration of new maps that will be made as new photographs become available. The creation of future maps will allow us to continue studying the evolution of the landscape and its dynamics of change. At the same time, the conclusions drawn from the project should serve as a basis for improving spatial planning in the country.