Projects

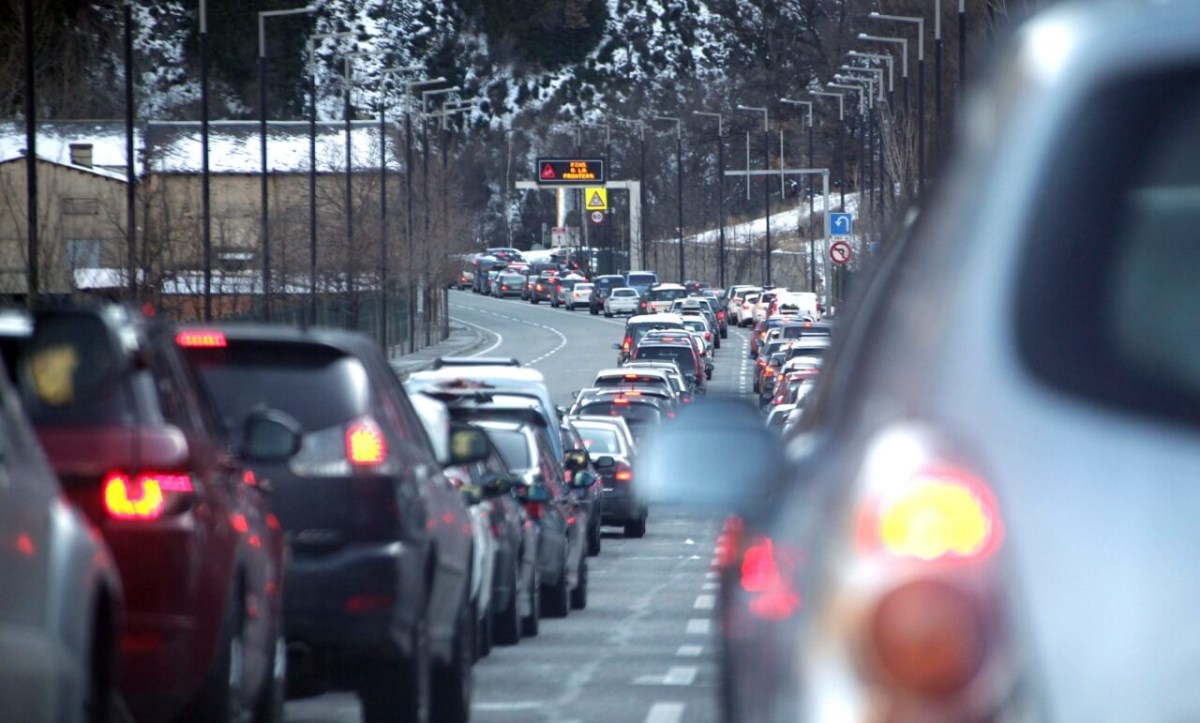
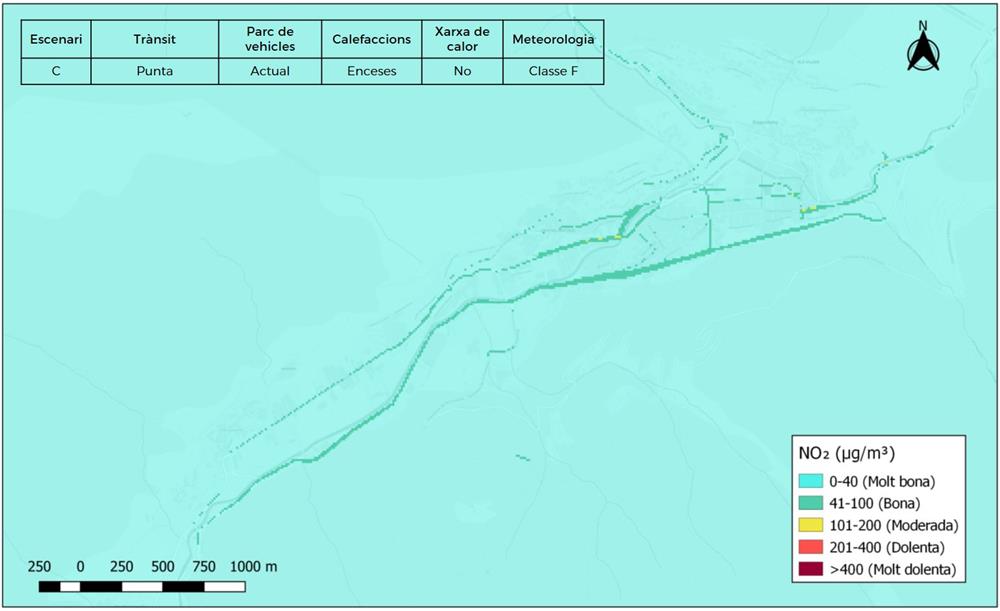
Using the ADMS-Urban model, and based on vehicle counts, diesel heating, industrial zones and meteorological data, we modeled the pollutants dispersion in the central valley of Andorra. This model allows to estimate the spatial distribution of the main pollutants, to study the causes, the incidence on the population and to propose improvement measures. The NO2 concentration levels in an adverse scenario are shown below. This considers traffic rush hour, the current vehicle fleet, the heaters in operation and a meteorological situation of thermal inversion that hinders the dispersion of pollutants.

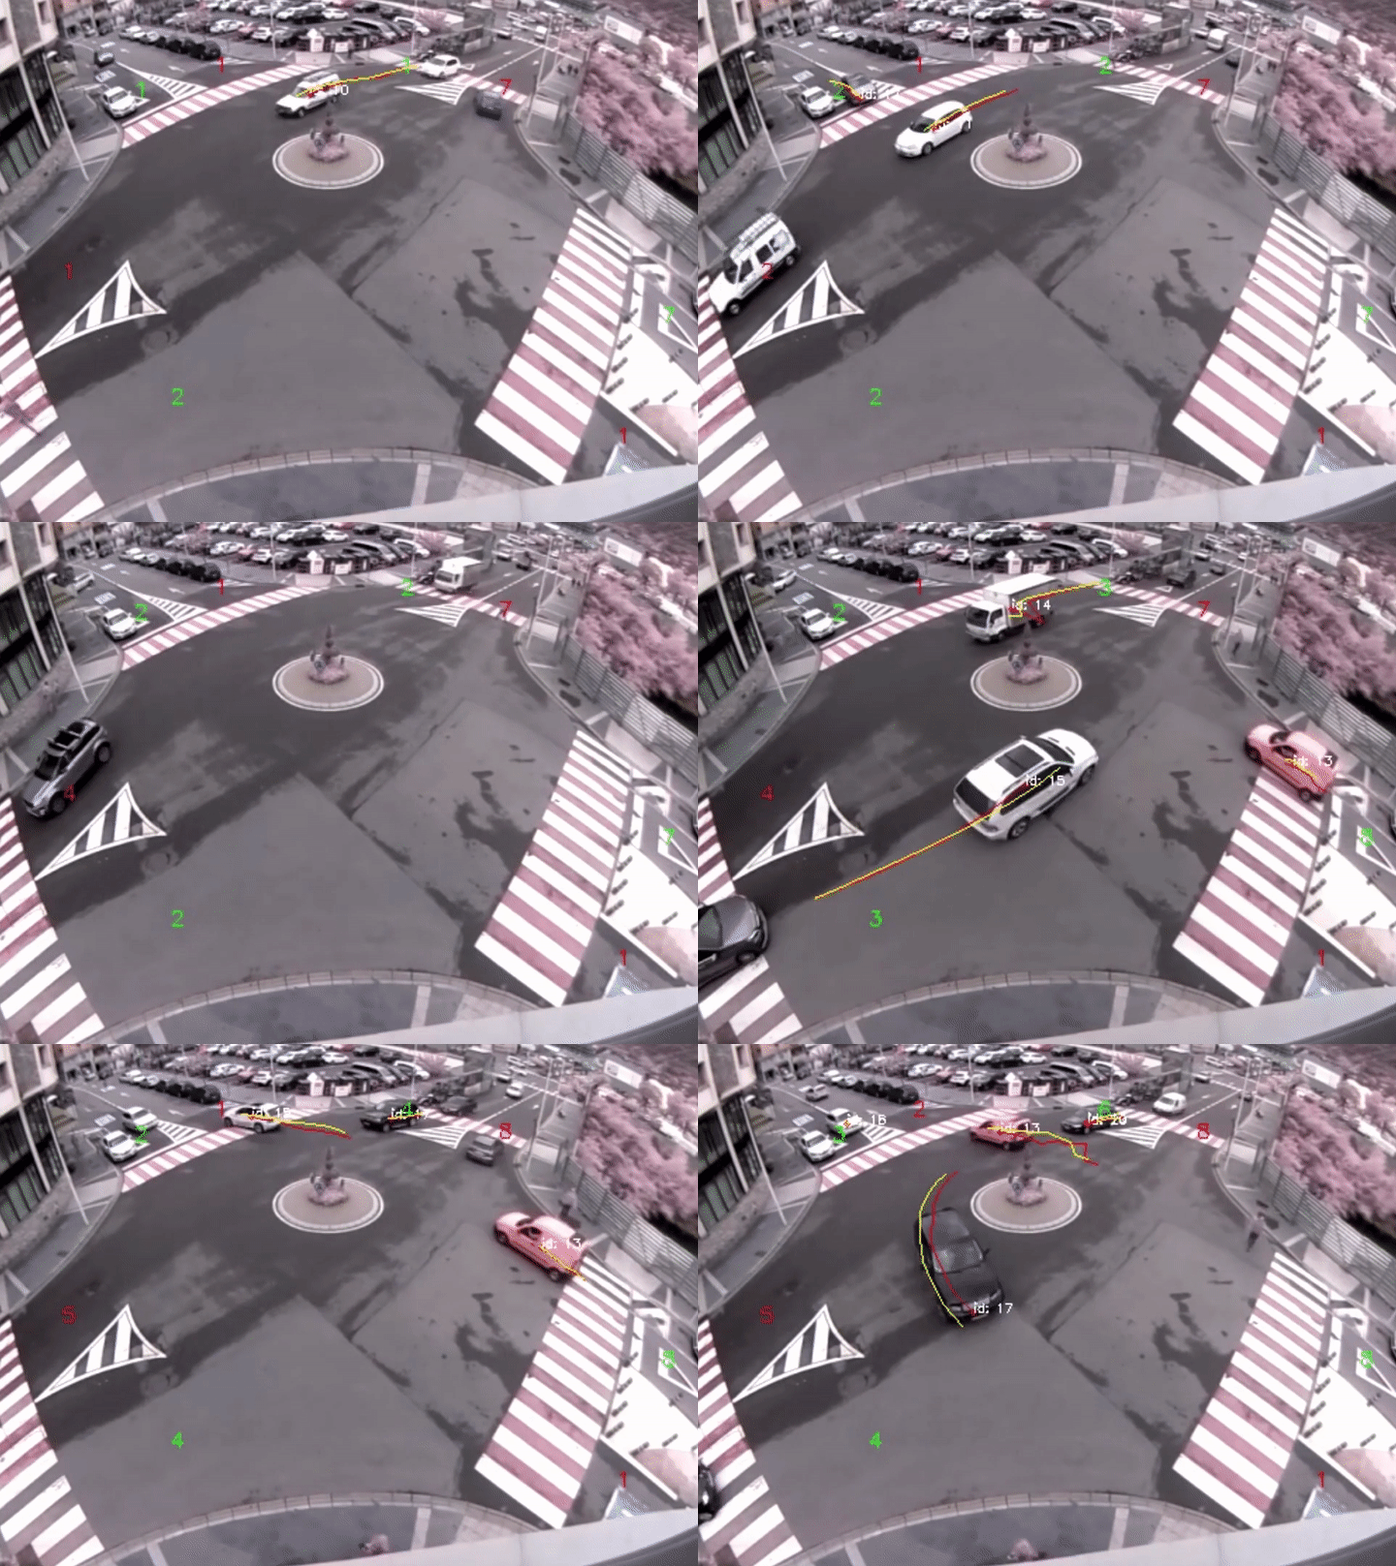
In order to enrich the available data on the intensity of vehicles, an experimental network of vehicle counters based on computer vision techniques was designed, implemented and tested, with the aim of complementing the data on vehicle counts provided by the Mobility Area of the Government of Andorra.

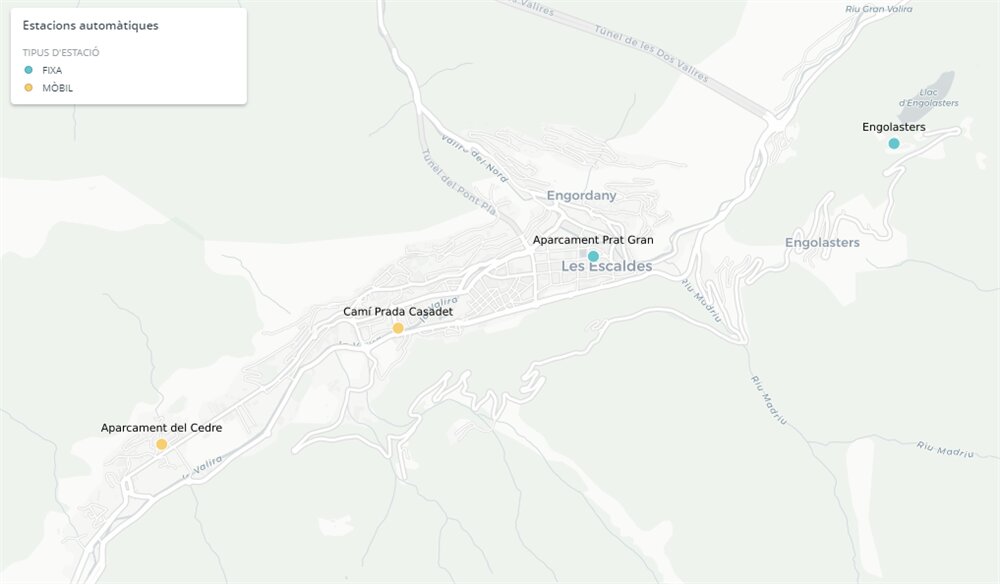
At the same time, based on available records, this project studies the historical evolution of the main air pollutants (NO2, PM10, O3, CO, SO2). The existing correlations with causal factors such as traffic, diesel heating and meteorology (with special emphasis on the effect of thermal inversions) were analyzed. The analysis deal with data provided by the Atmospheric Environment Unit of the Department of Environment of the Government of Andorra including the period 01/01/2017 to 07/03/2018. Additionally, and only for the reference station (942), we developed an analysis of greater temporal range, which includes data from the period 01/01/2010 to 31/12/2017. These last ones have been downloaded through the web of Air Quality of the Government of Andorra [1].
Most of the results obtained have been published on the following website, where you can consult the different analysis carried out with the data from the automatic stations of the country.

The final report "Avaluació i modelització de la contaminació atmosfèrica a Andorra" (Assessment and modelling of atmospheric pollution in Andorra) presents in detail the methodology and the main results of the project [2].
[1] Govern d'Andorra, "Qualitat de l'aire a Andorra, Dades de mesurament," 2018
[2] OBSA, "Avaluació i modelització de la contaminació atmosfèrica a Andorra," 2018

 Marc Vilella
 Oriol Travesset